Java性能监控与调优
基于JDK命令行工具的监控
参考文档:https://docs.oracle.com/javase/8/docs/technotes/tools/unix/toc.html
JVM参数类型
标准参数
- -version
- -help
- -cp -classpath
- -server -client
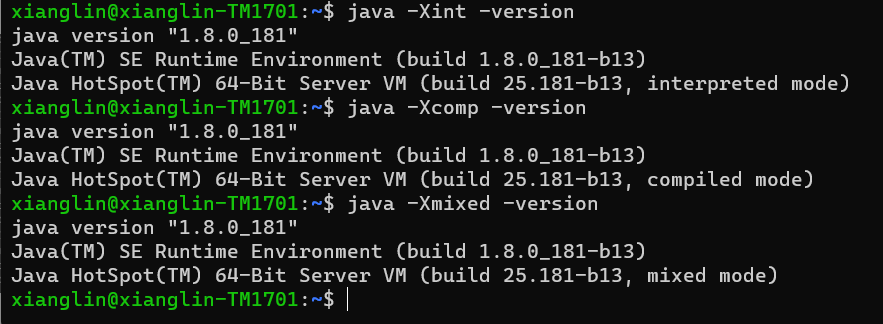
X参数
- -Xint:解释执行
- -Xcomp:第一次使用就编译成本地代码
- -Xmixed:混合模式,JVM决定是否编译成本地代码
XX参数
- Boolean类型:
-XX:[+ -]<name>表示启用或者禁用name属性,比如:-XX:+UseG1GC。 - 其它类型:
-XX:<name>=<value>表示name属性的值是value,比如:-XX:MaxGCPauseMillis=500。
查看JVM运行时参数
-XX:+PrintFlagsInitial:查看虚拟机启动时使用的JVM参数。
-XX:+PrintFlagsFinal:打印所有系统参数和值。
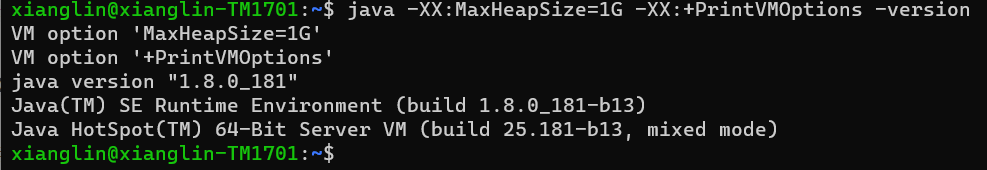
-XX:+PrintVMOptions:打印传递给虚拟机的显示参数。
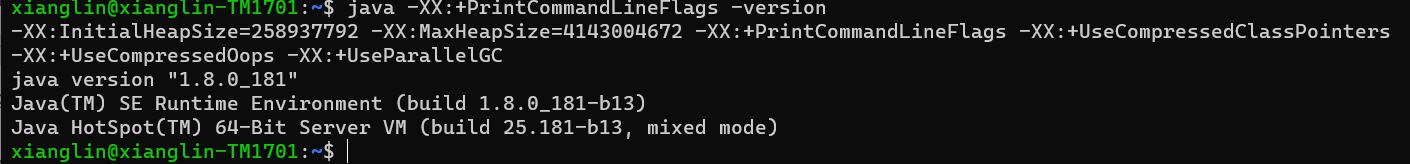
-XX:+PrintCommandLineFlags:打印传递给虚拟机的所有参数。
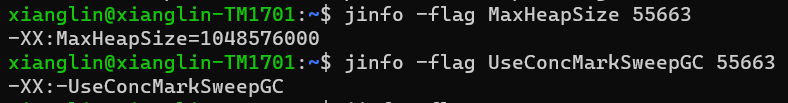
jinfo:查看或设置JVM参数。
https://docs.oracle.com/javase/8/docs/technotes/tools/unix/jinfo.html
jstat查看JVM统计信息
https://docs.oracle.com/javase/8/docs/technotes/tools/unix/jstat.html
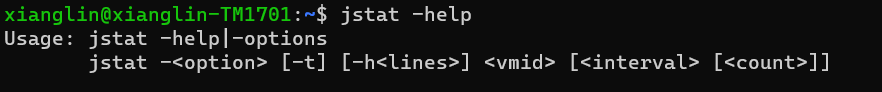
options参数:
-class:类加载信息。
-compiler -printcompilation:Java HotSpot虚拟机JIT编译信息。
-gc -gccapacity -gccause -gcmetacapacity -gcnew -gcnewcapacity -gcold -gcoldcapacity -gcutil:GC信息。
jmap和MAT定位内存溢出
通过不断创建对象和不断生成类来构造堆内存和元空间内存溢出情况:
@RestController
public class MemoryController {
    private final List<User> userList = new ArrayList<>();

    /**
     * -Xmx32m -Xms32m
     */
    @GetMapping("/heap")
    public String heap() {
        int i = 0;
        while (true) {
            userList.add(new User(i++, UUID.randomUUID().toString()));
        }
    }

    private final List<Class<?>> classList = new ArrayList<>();

    /**
     * -XX:MetaspaceSize=32m -XX:MaxMetaspaceSize=32m
     */
    @GetMapping("/nonHeap")
    public String nonHeap() {
        while (true) {
            classList.addAll(Metaspace.createClasses());
        }
    }
}
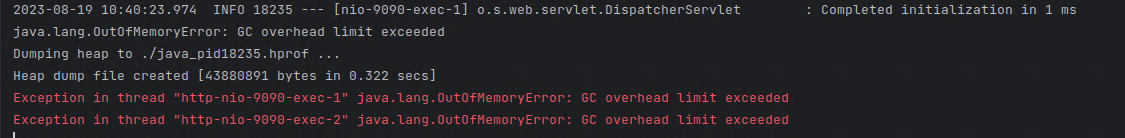
发生内存溢出时自动导出:
-XX:+HeapDumpOnOutOfMemoryError
-XX:HeapDumpPath=./

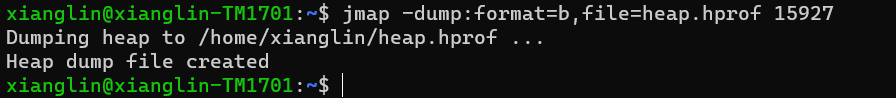
使用jmap命令手动导出:
jmap -dump:format=b,file=heap.hprof 15927
Memory Analyzer 下载地址:https://eclipse.dev/mat/downloads.php
使用Memory Analyzer打开内存映像文件,默认展示可能存在内存泄漏的情况。
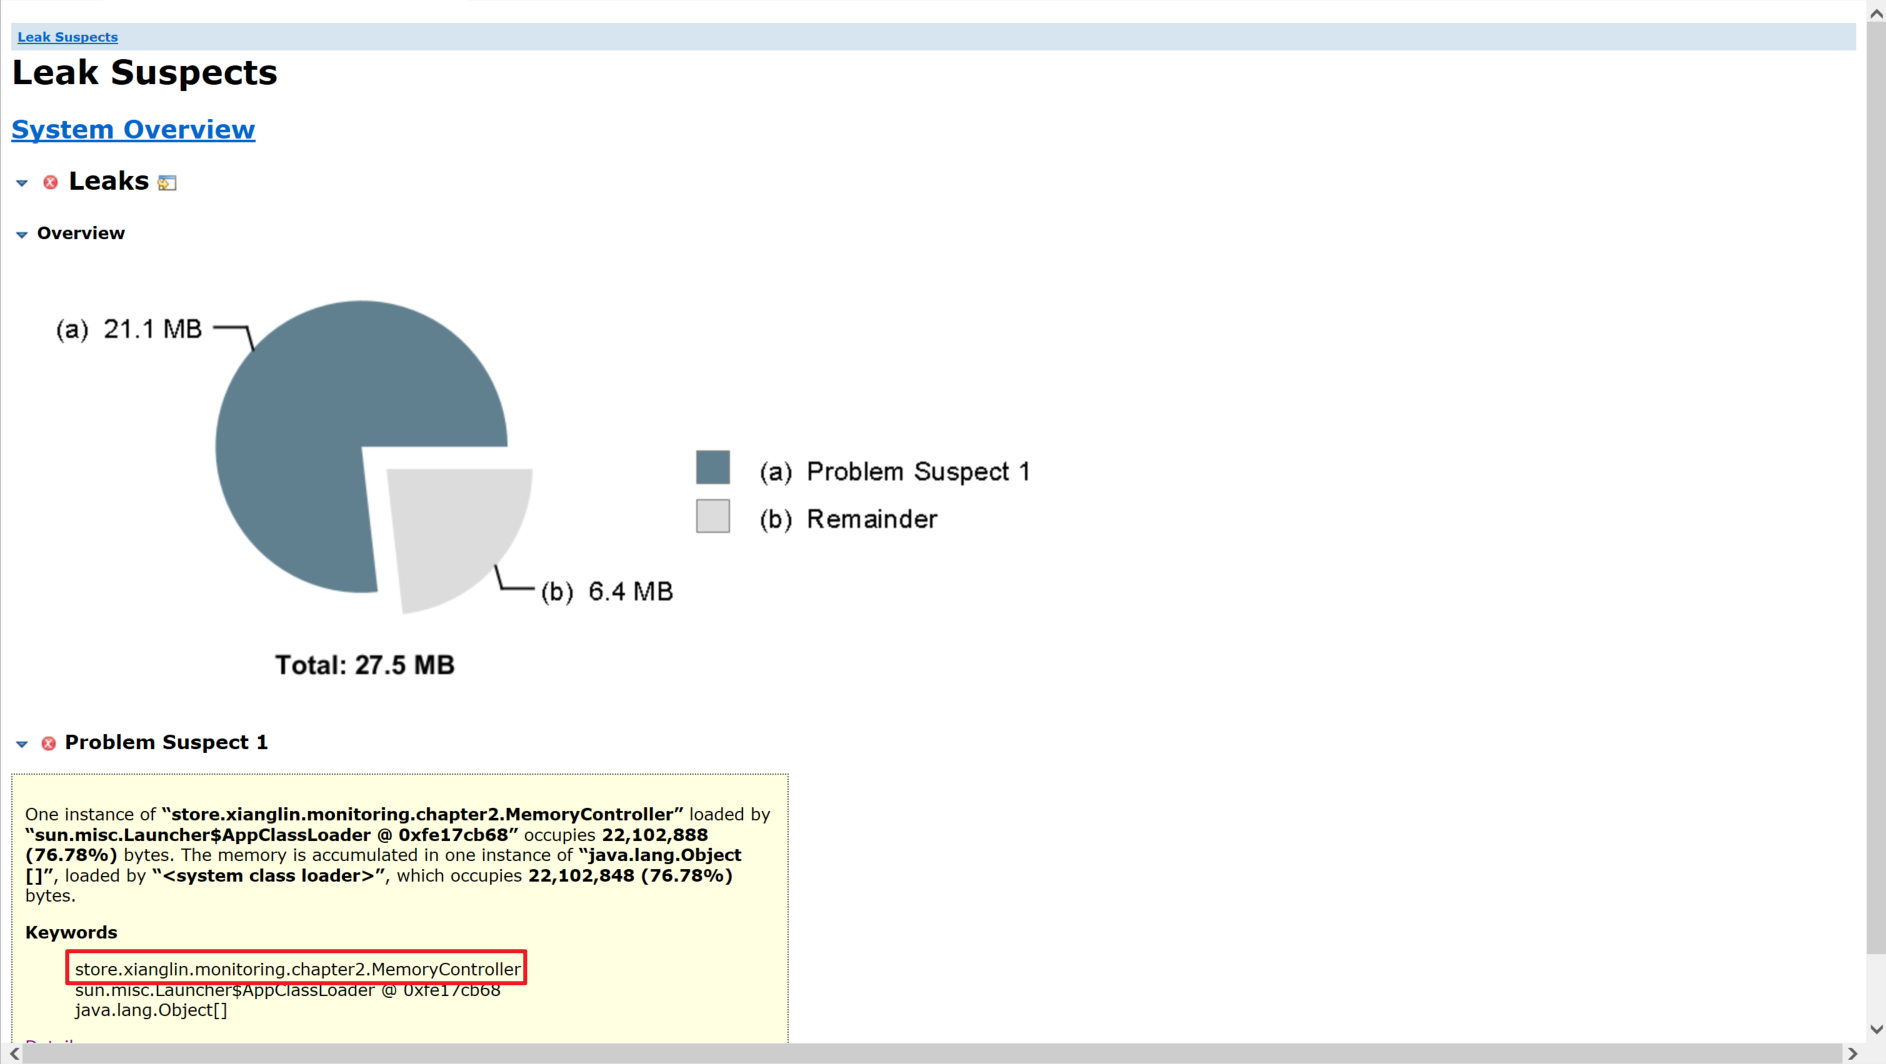
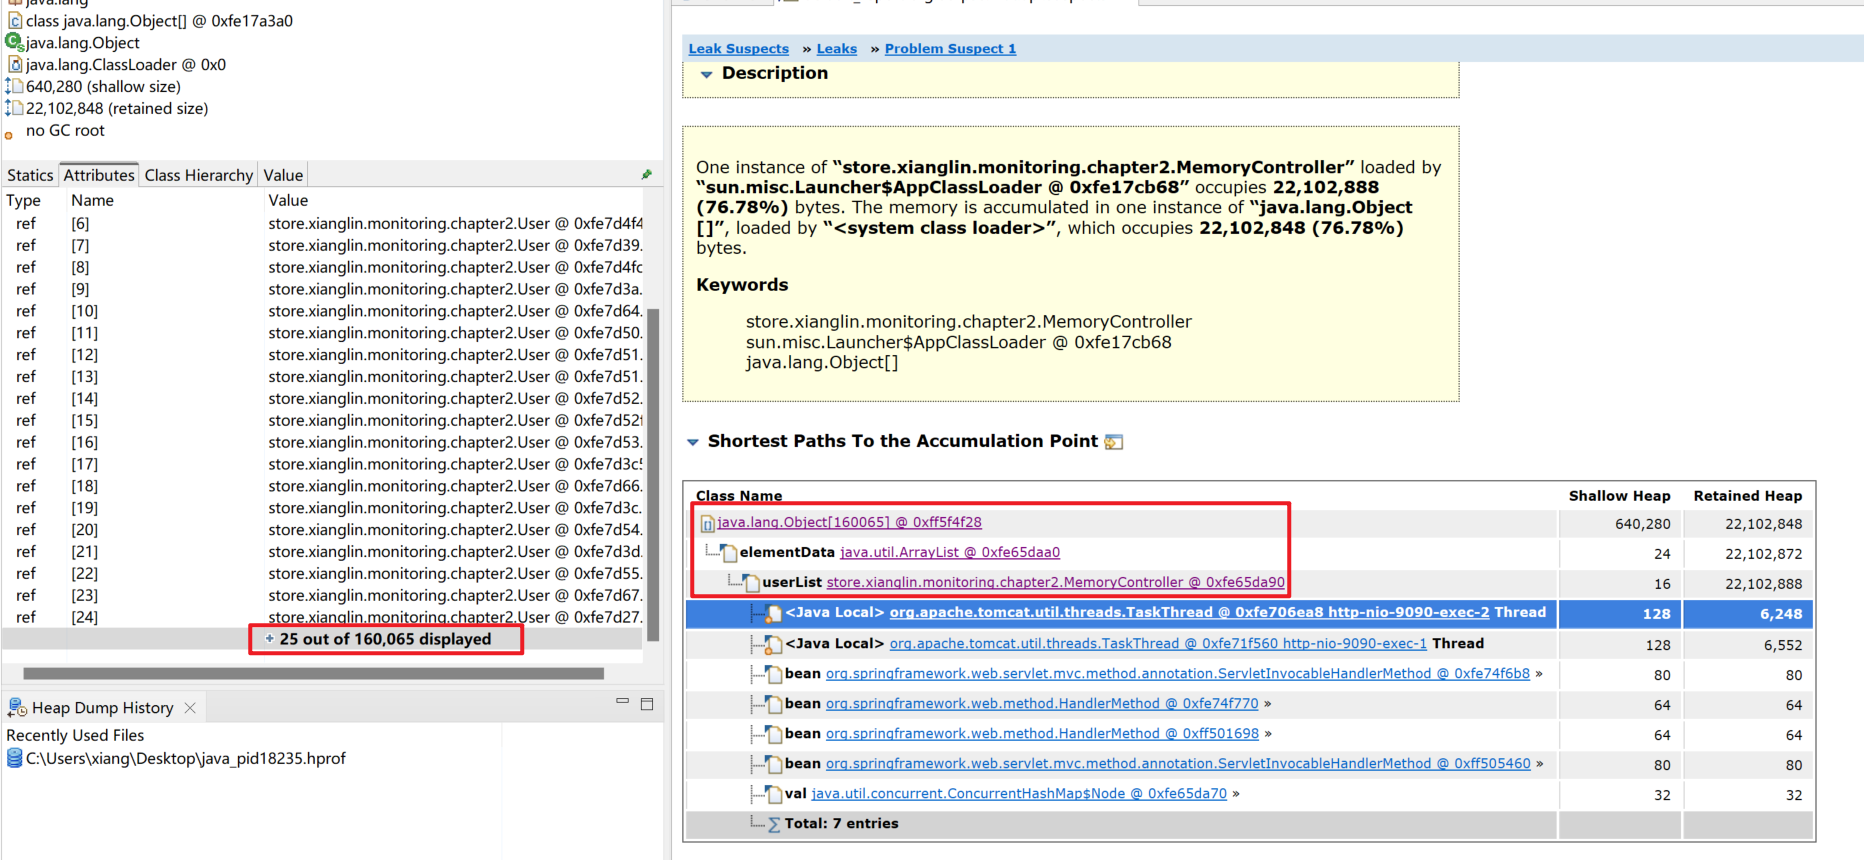
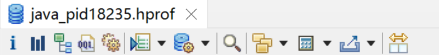
前三个按钮分别表示:概要图、对象直方图、堆内存分配树。
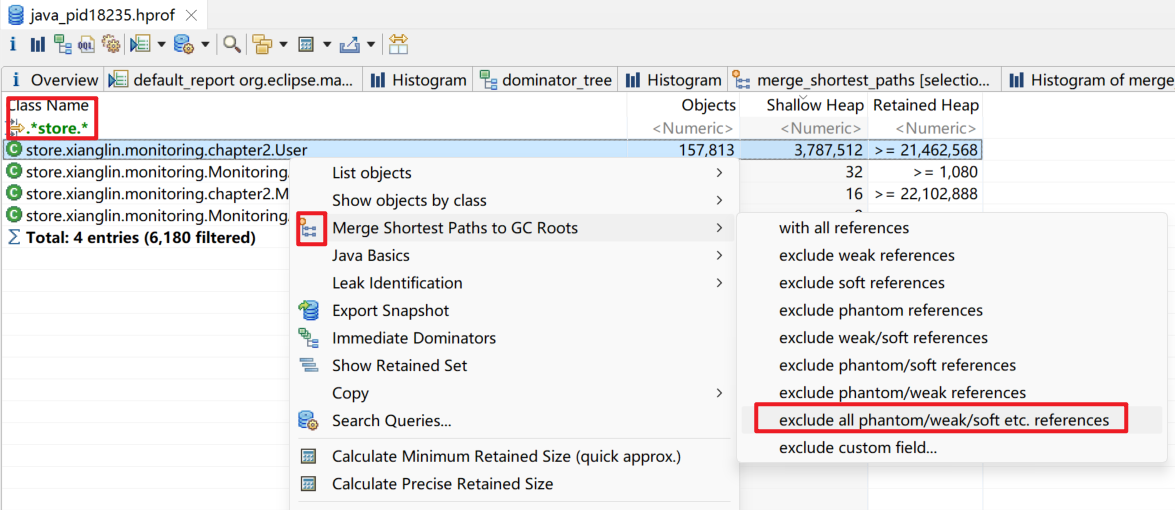
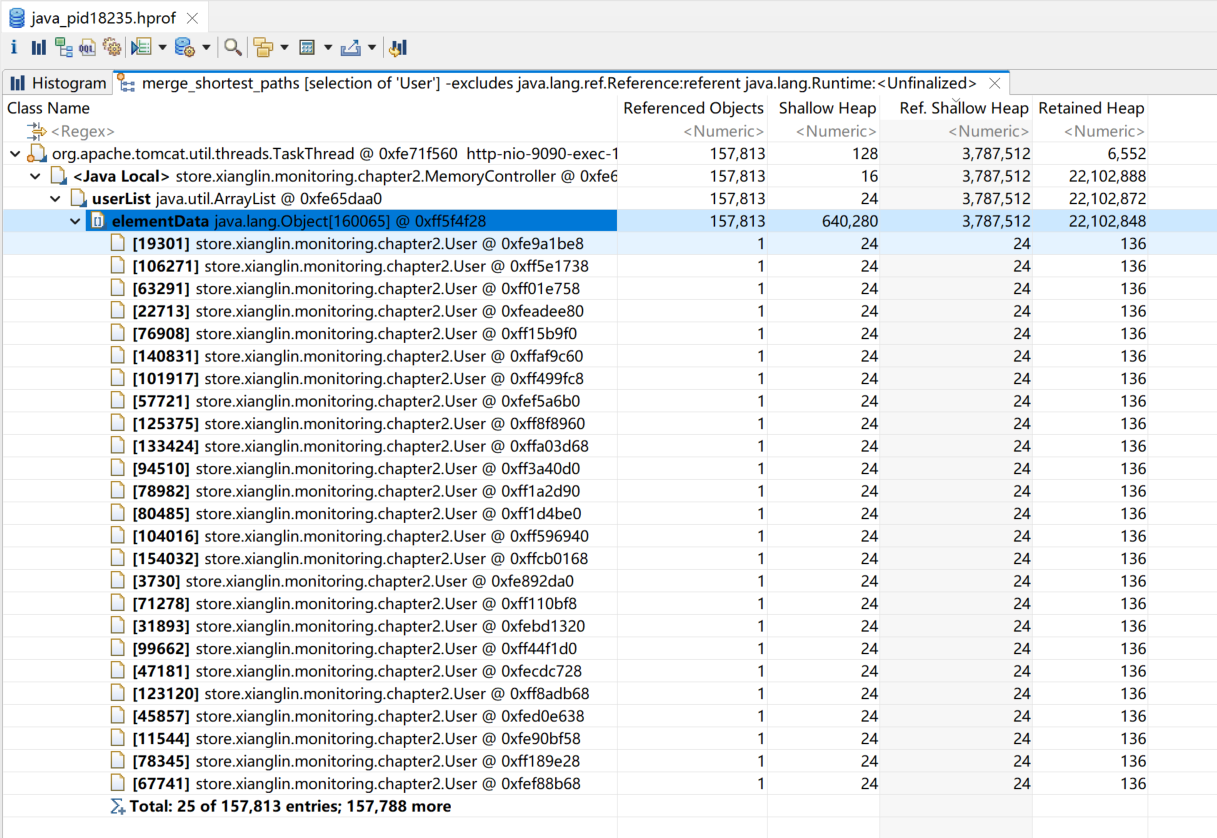
对象直方图可按类名称过滤,在User上右键查看对象的GC Roots,可以发现所有对象都由MemoryController.userList持有。
jstack和死循环与死锁
线程状态:https://docs.oracle.com/javase/8/docs/technotes/guides/troubleshoot/tooldescr034.html
| Thread State | Description |
|---|---|
| NEW | The thread has not yet started. |
| RUNNABLE | The thread is executing in the JVM. |
| BLOCKED | The thread is blocked waiting for a monitor lock. |
| WAITING | The thread is waiting indefinitely for another thread to perform a particular action. |
| TIMED_WAITING | The thread is waiting for another thread to perform an action for up to a specified waiting time. |
| TERMINATED | The thread has exited. |
通过代码构造死循环和死锁情况:
@RestController
public class CPUController {
    /**
     * 死循环
     */
    @RequestMapping("/loop")
    public String loop() {
        return doLoop(1);
    }
    private String doLoop(int i) {
        while (i > 0) {
            ++i;
            --i;
        }
        return "completed";
    }

    private final Object lock1 = new Object();
    private final Object lock2 = new Object();
    /**
     * 死锁
     */
    @RequestMapping("/deadlock")
    public String deadlock() {
        new Thread(() -> {
            synchronized (lock1) {
                try {
                    Thread.sleep(1000);
                } catch (Exception ignored) {
                }
                synchronized (lock2) {
                    System.out.println("Thread1 over");
                }
            }
        }).start();
        new Thread(() -> {
            synchronized (lock2) {
                try {
                    Thread.sleep(1000);
                } catch (Exception ignored) {
                }
                synchronized (lock1) {
                    System.out.println("Thread2 over");
                }
            }
        }).start();
        return "deadlock";
    }
}
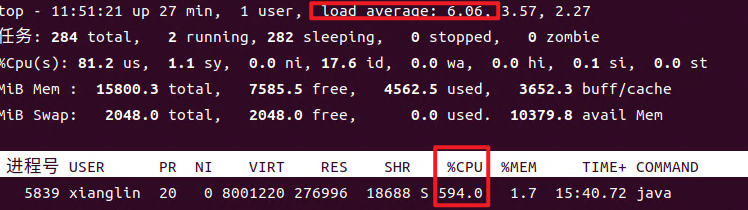
使用top命令查看CPU负载情况,发现load average值达到6(https://unix.stackexchange.com/questions/9465/understanding-top-and-load-average),java进程占用CPU较高,使用top -p 5839 -H查看线程情况。
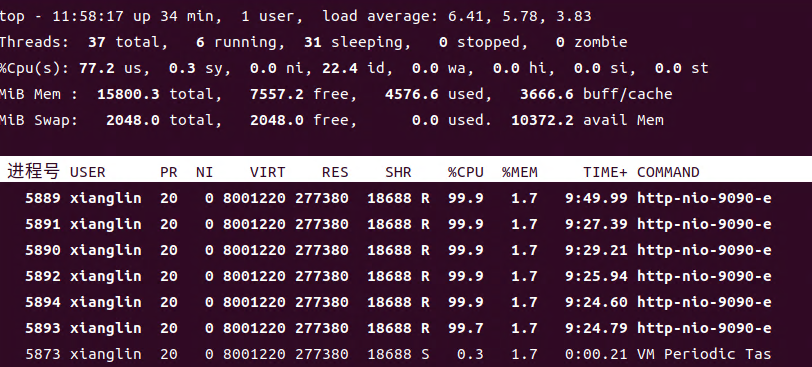
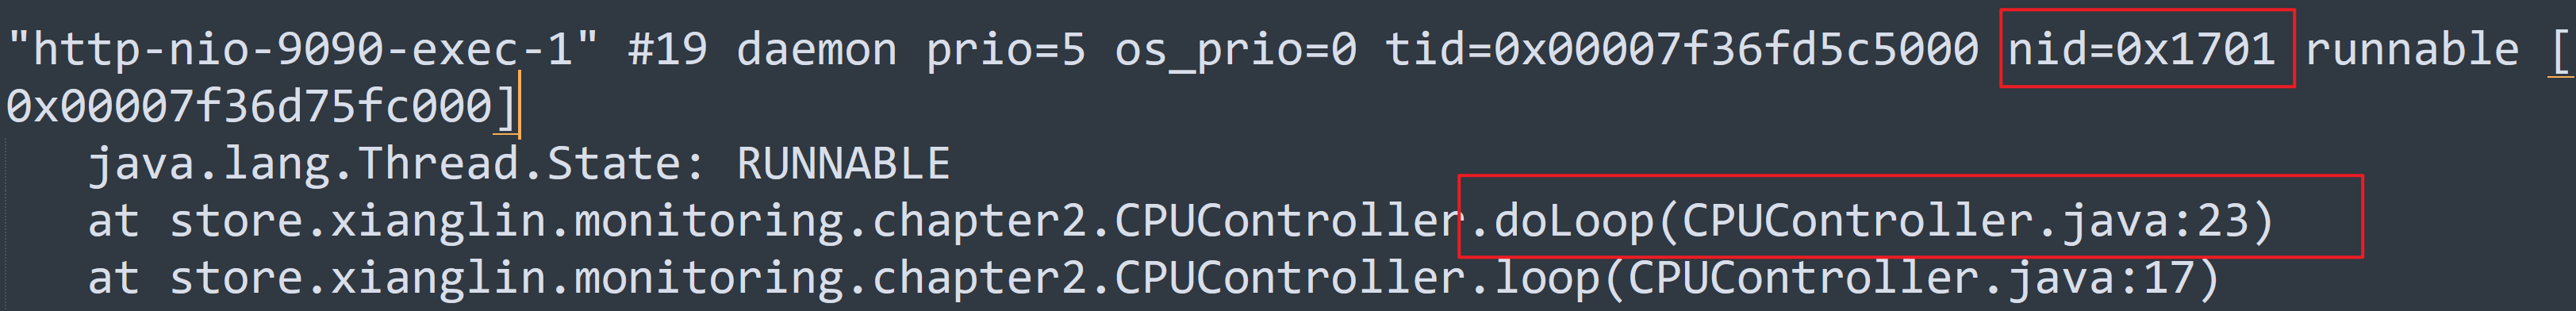
使用jstack 5839 > 5839.txt导出Java线程信息,将十进制线程号5889转换为十六进制1701,在5839.txt中定位到对应的线程信息,即可发现问题代码。
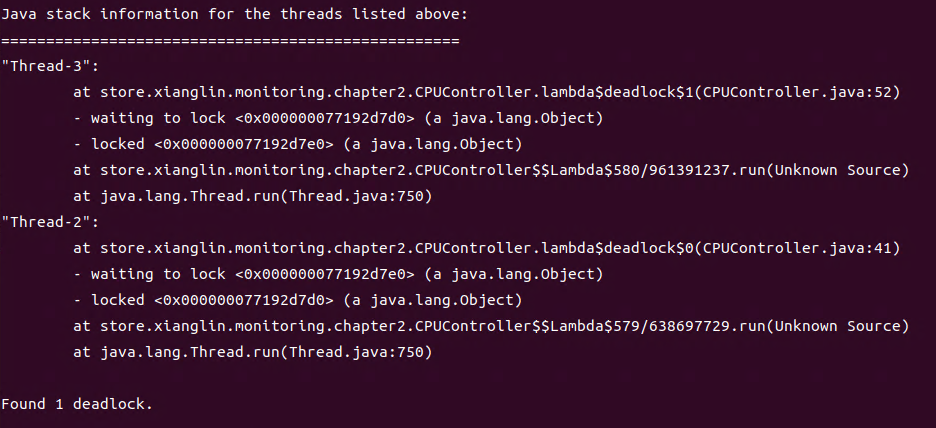
jstack导出的Java线程信息会展示死锁相关信息。
基于JVisualVM的可视化监控
VisualVM文档:https://visualvm.github.io/documentation.html
JMX文档:https://www.oracle.com/technical-resources/articles/javase/jmx.html
jstatd文档:https://docs.oracle.com/javase/6/docs/technotes/tools/share/jstatd.html
基于BTrace的监控调试
Btrace文档:https://github.com/btraceio/btrace
下载安装BTrace
从https://github.com/btraceio/btrace/releases下载BTrace,可以选择将其加入环境变量。
编写BTrace脚本
编写一个简单的脚本打印方法参数:
@RestController
@RequestMapping("/ch4")
public class Ch4Controller {
    @GetMapping("/arg1")
    public String arg1(@RequestParam("name") String name) {
        return "hello " + name;
    }
}

// BTrace脚本
import org.openjdk.btrace.core.BTraceUtils;
import org.openjdk.btrace.core.annotations.*;
import org.openjdk.btrace.core.types.AnyType;

@BTrace
public class PrintArgSimple {

    @OnMethod(
            clazz = "store.xianglin.monitoring.chapter4.Ch4Controller",
            method = "arg1",
            location = @Location(Kind.ENTRY)
    )
    public static void anyRead(@ProbeClassName String pcn, @ProbeMethodName String pmn, AnyType[] args) {
        BTraceUtils.printArray(args);
        BTraceUtils.println(pcn + "," + pmn);
        BTraceUtils.println();
    }
}
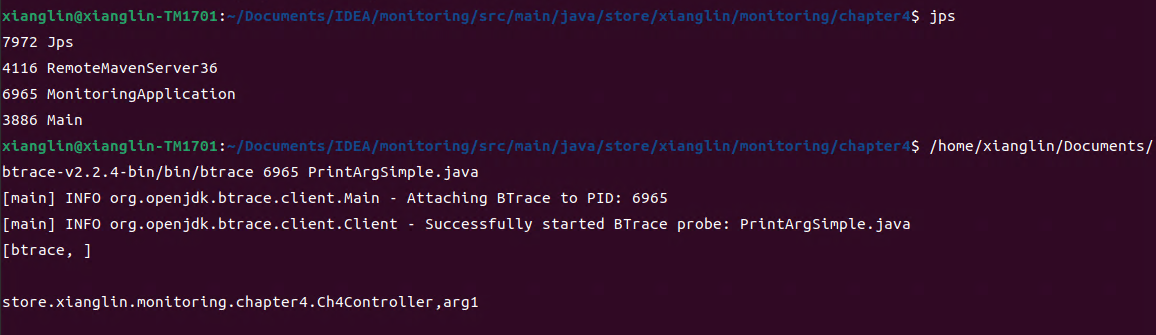
运行BTrace脚本
使用<btrace>/bin/btrace <PID> <trace_script>命令格式来运行BTrace脚本:
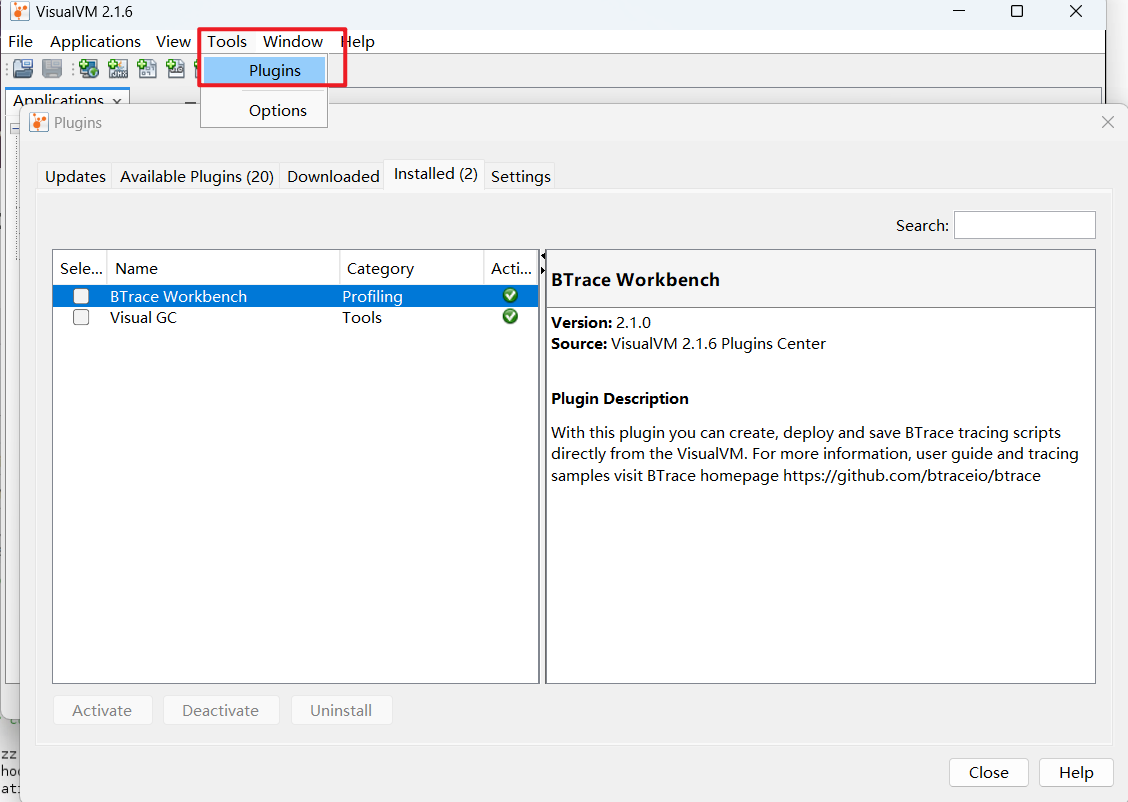
借助BTrace Workbench插件执行BTrace脚本
在VisualVM中安装BTrace Workbench插件。
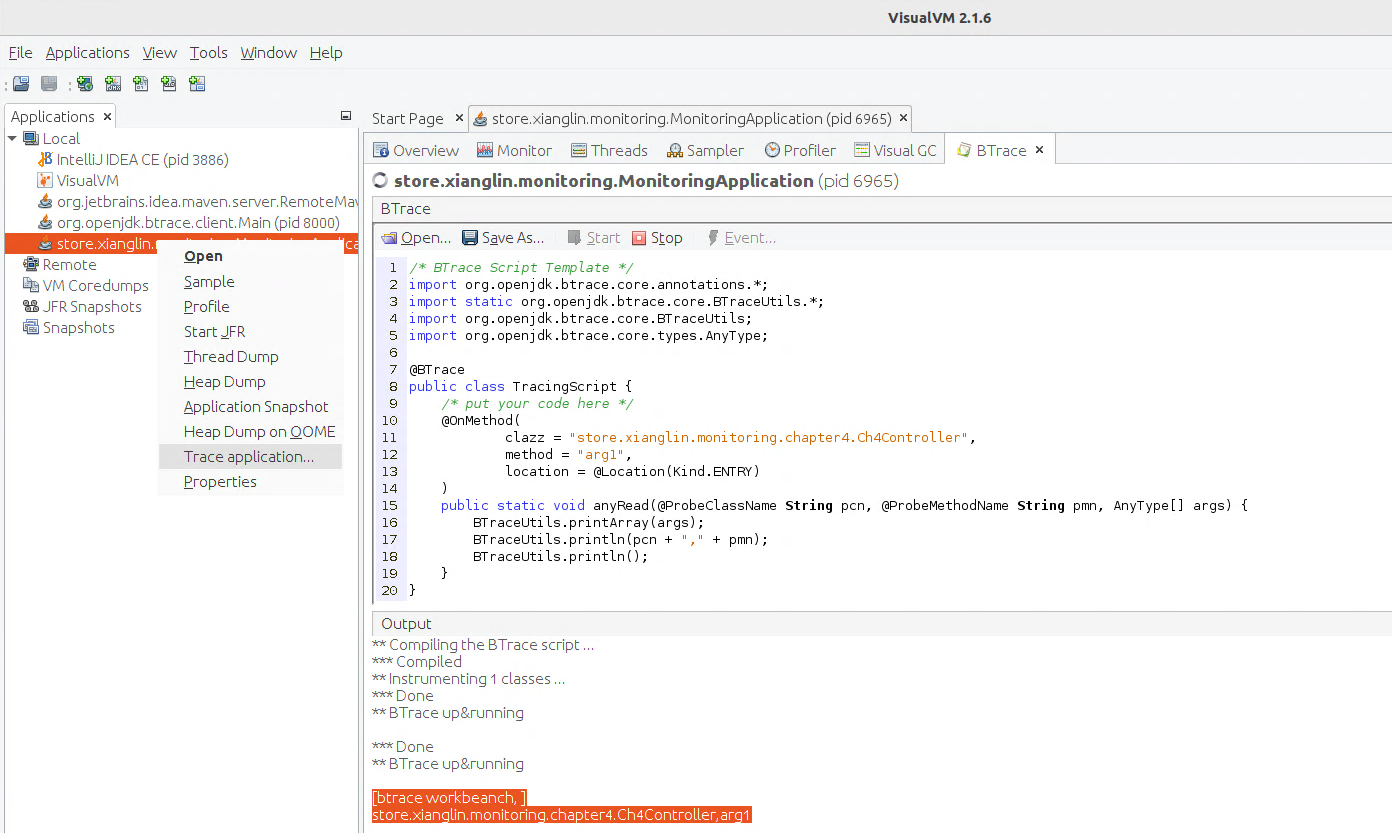
在目标应用上右键选择“Trace application”打开BTrace Workbench,在编辑框中编写BTrace脚本后点击“start”即可运行BTrace脚本。
Tomcat性能监控与调优
Tomcat远程Debug
JDWP协议:https://docs.oracle.com/javase/8/docs/technotes/guides/troubleshoot/introclientissues005.html
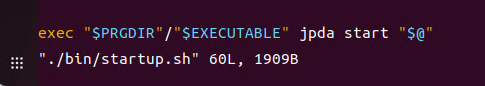
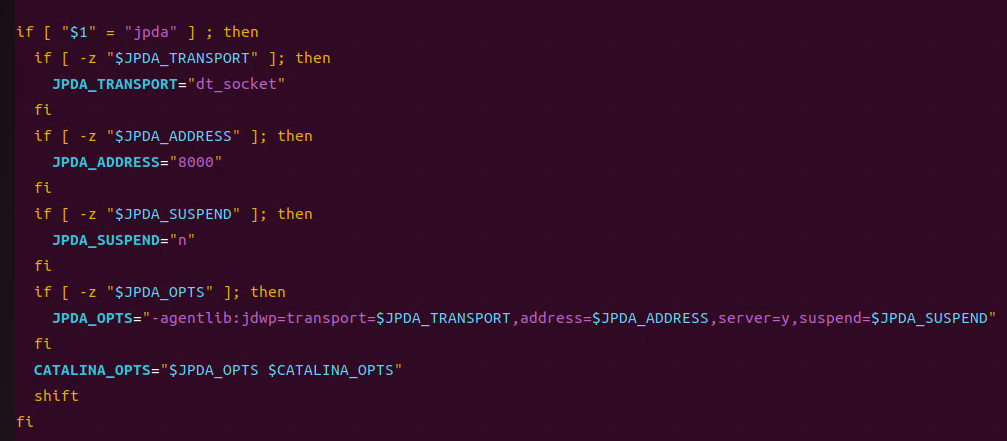
修改bin/startup.sh文件在启动命令上添加jpda参数。
修改bin/catalina.sh文件中JPDA_ADDRESS配置。
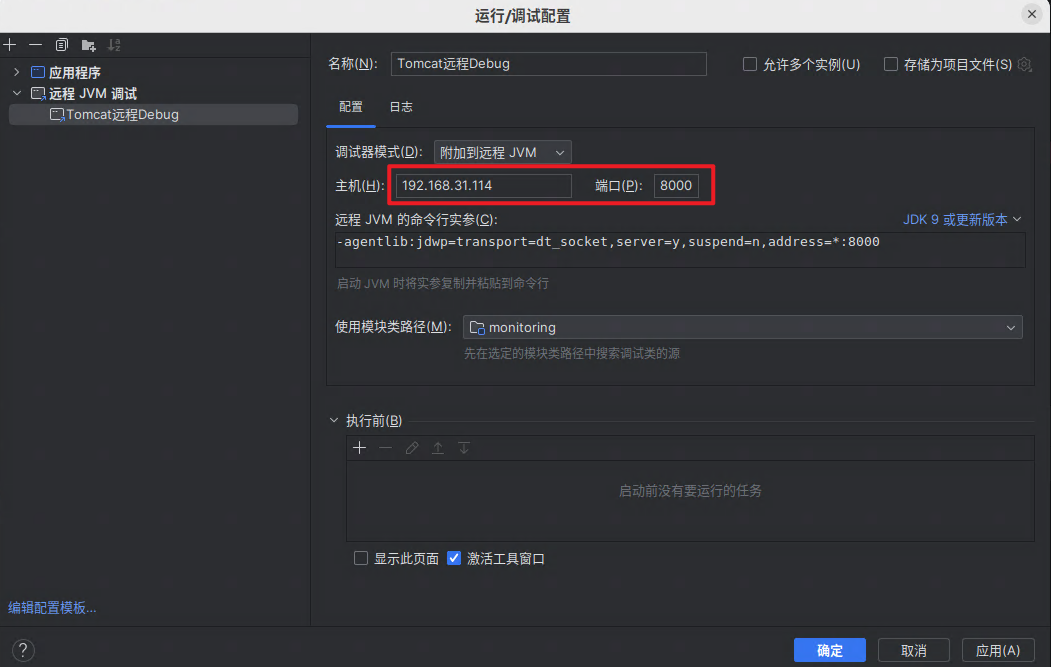
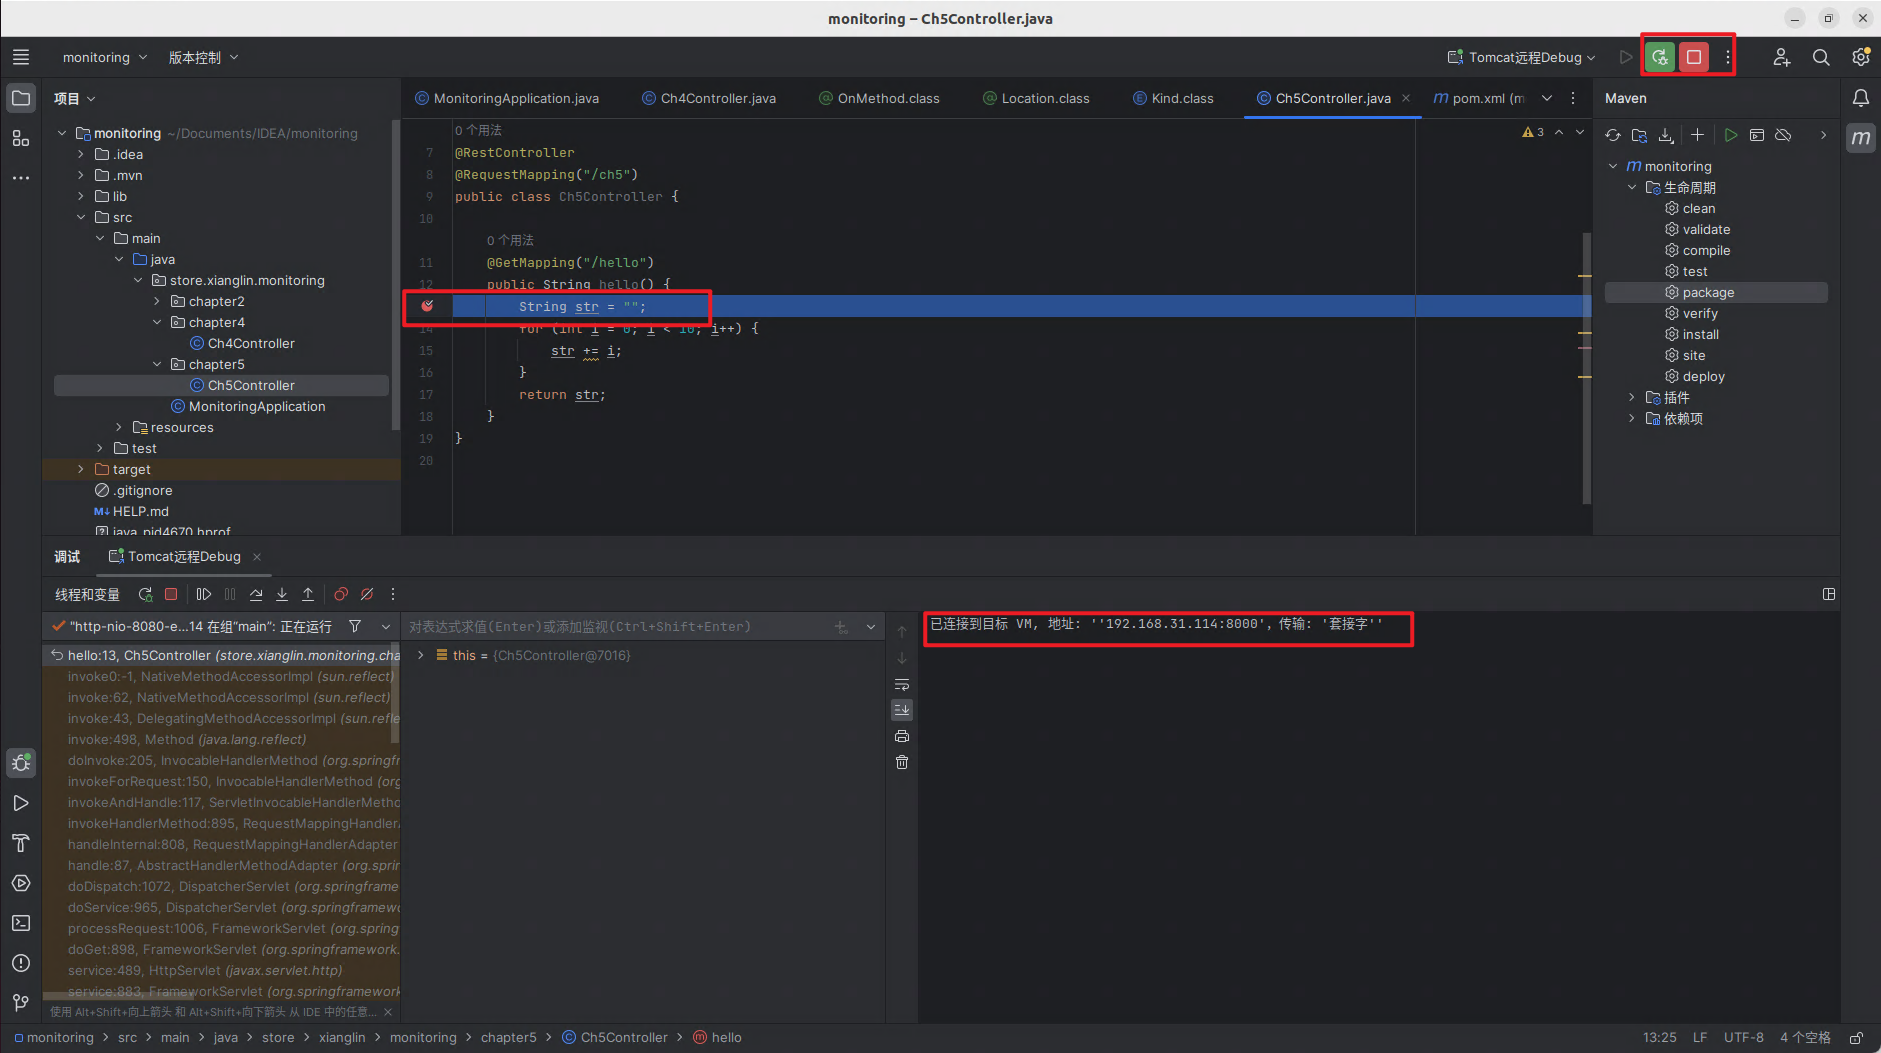
在IDEA中配置远程JVM调试,即可连接到Tomcat。
Tomcat-manager监控
文档地址:<tomcat>/docs/manager-howto.html
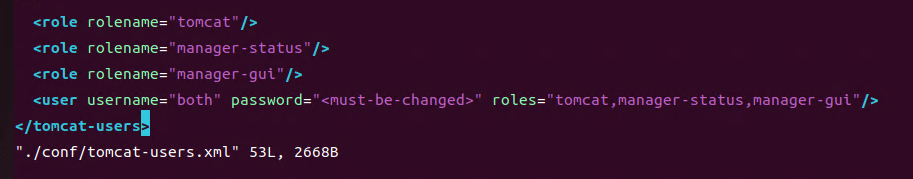
修改conf/tomcat-users.xml文件中角色和用户的配置。
<?xml version="1.0" encoding="UTF-8"?>
<tomcat-users xmlns="http://tomcat.apache.org/xml"
              xmlns:xsi="http://www.w3.org/2001/XMLSchema-instance"
              xsi:schemaLocation="http://tomcat.apache.org/xml tomcat-users.xsd"
              version="1.0">
  <role rolename="tomcat"/>
  <role rolename="manager-status"/>
  <role rolename="manager-gui"/>
  <user username="tomcat" password="tomcat" roles="tomcat,manager-status,manager-gui"/>
</tomcat-users>
新建文件conf/Catalina/localhost/manager.xml增加如下配置:
<?xml version="1.0" encoding="UTF-8"?>
<Context privileged="true">
         <Valve className="org.apache.catalina.valves.RemoteAddrValve"
                allow="127\.0\.0\.1"/>
</Context>
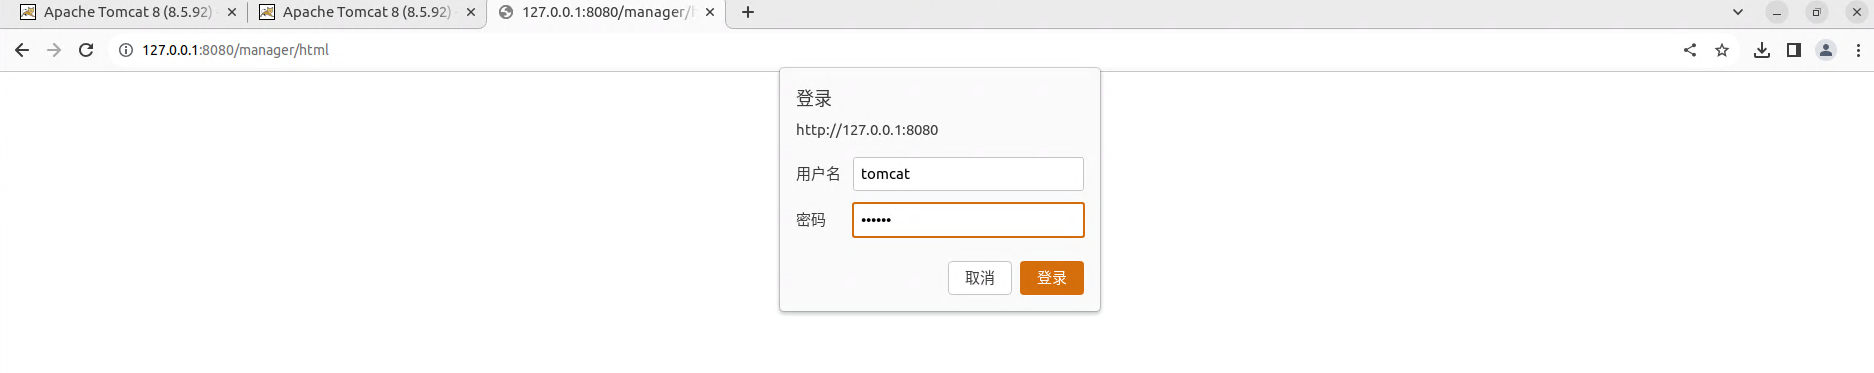
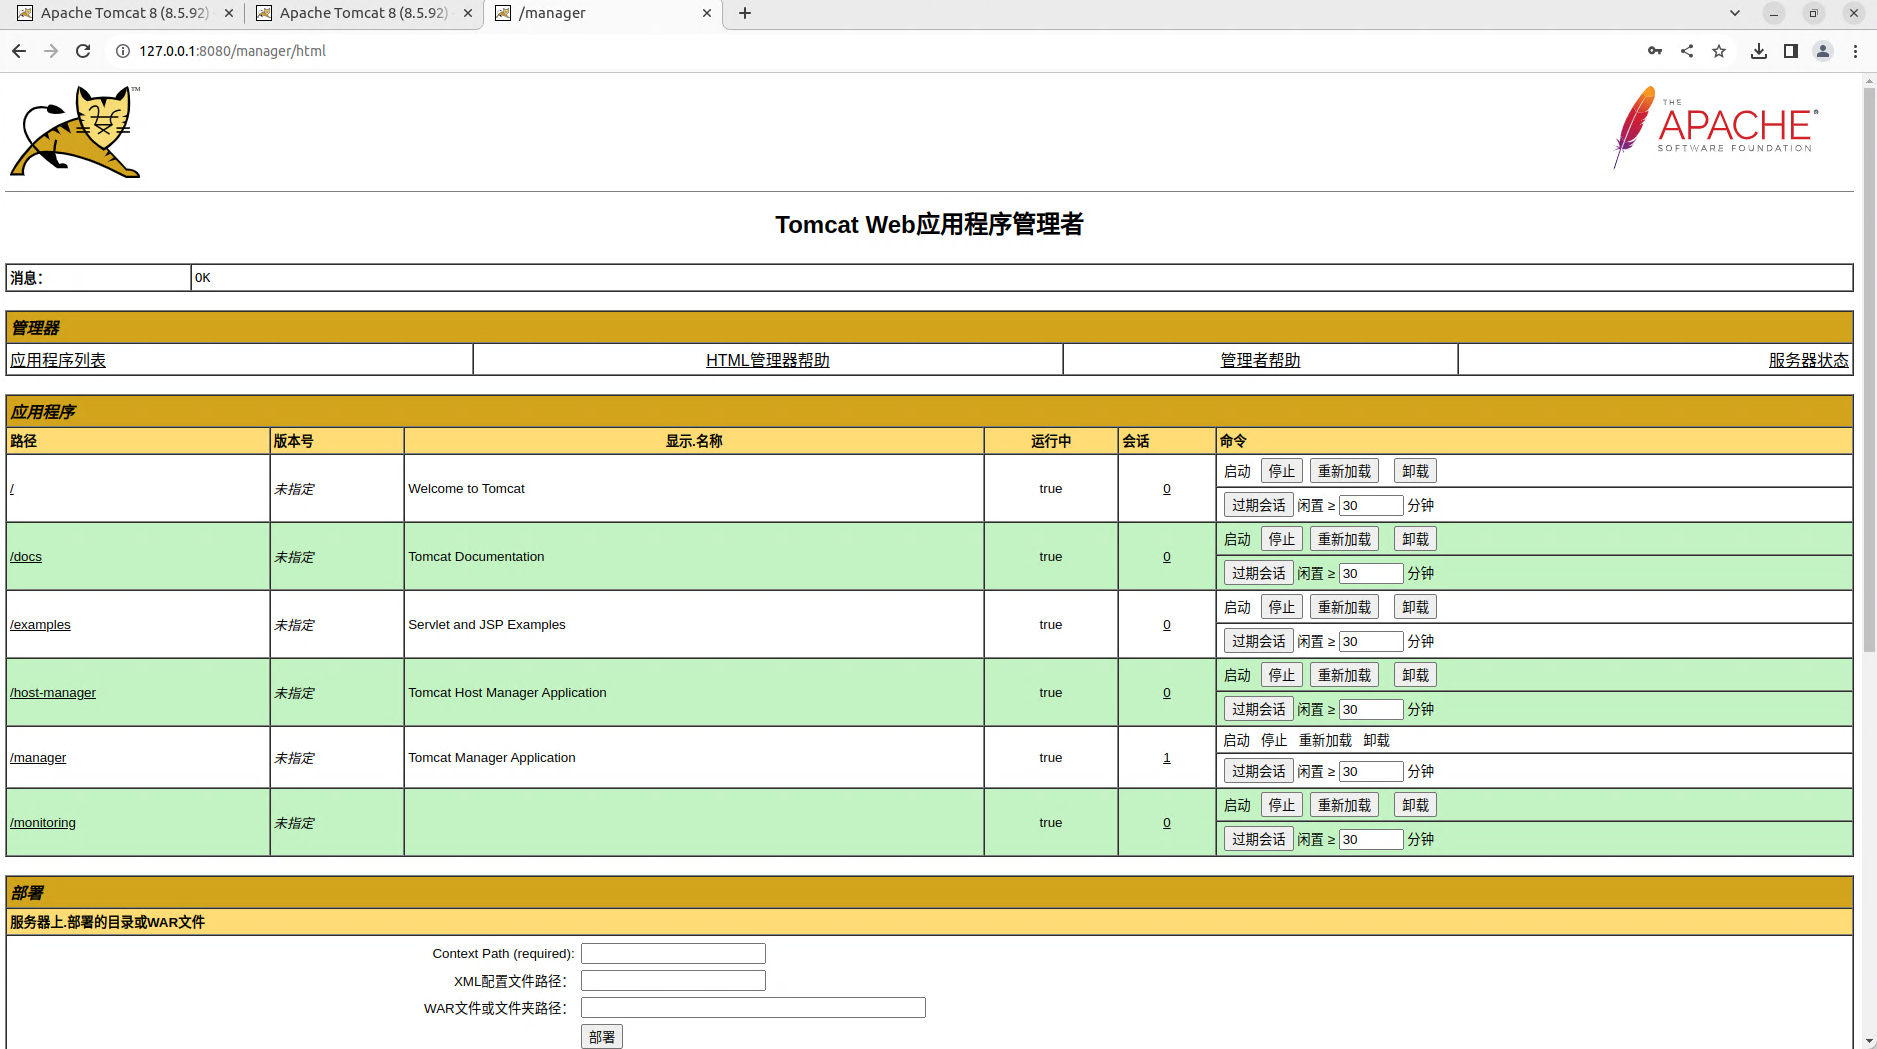
重启Tomcat后打开http://127.0.0.1:8080/manager/html输入用户名和密码,即可进入管理界面。
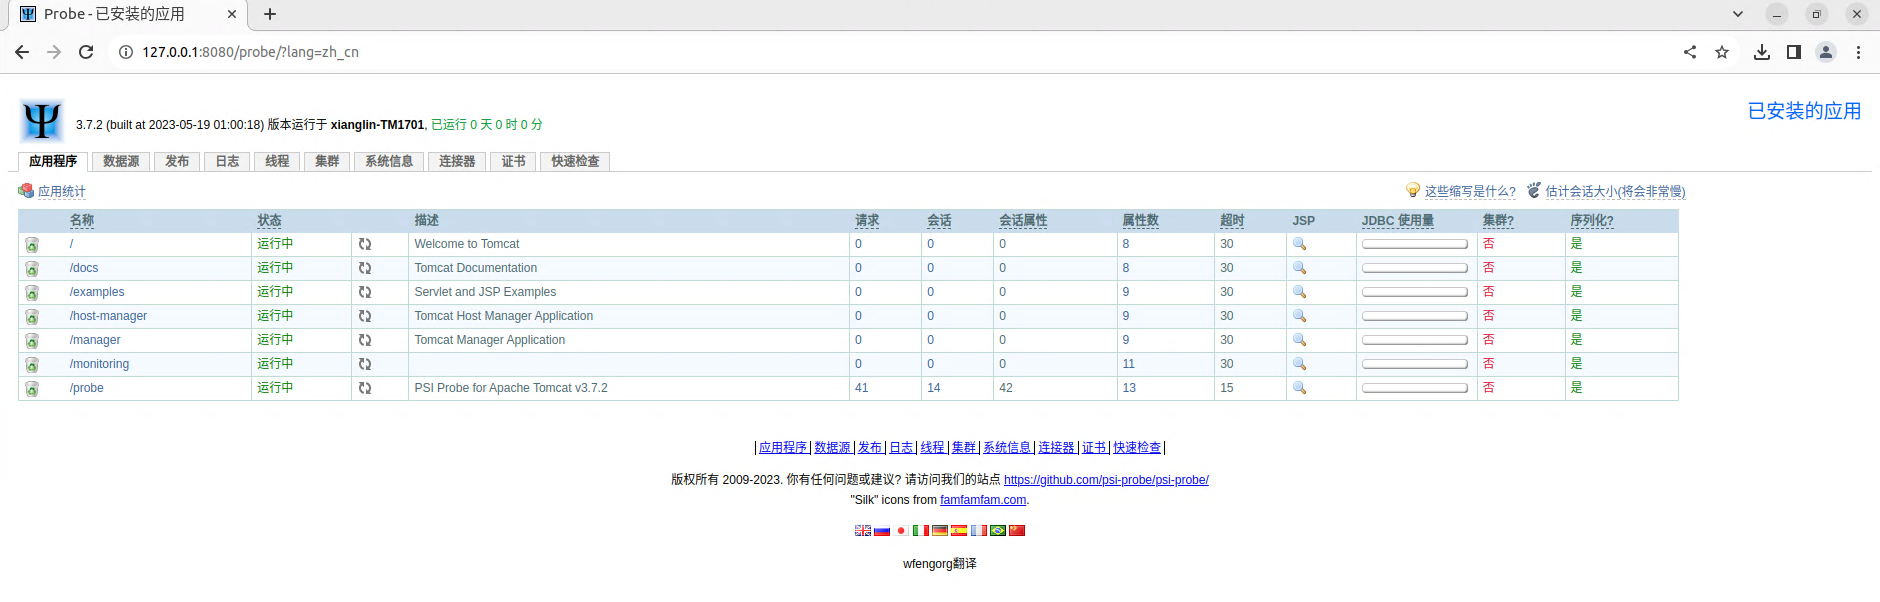
psi-probe监控
文档地址:https://github.com/psi-probe/psi-probe
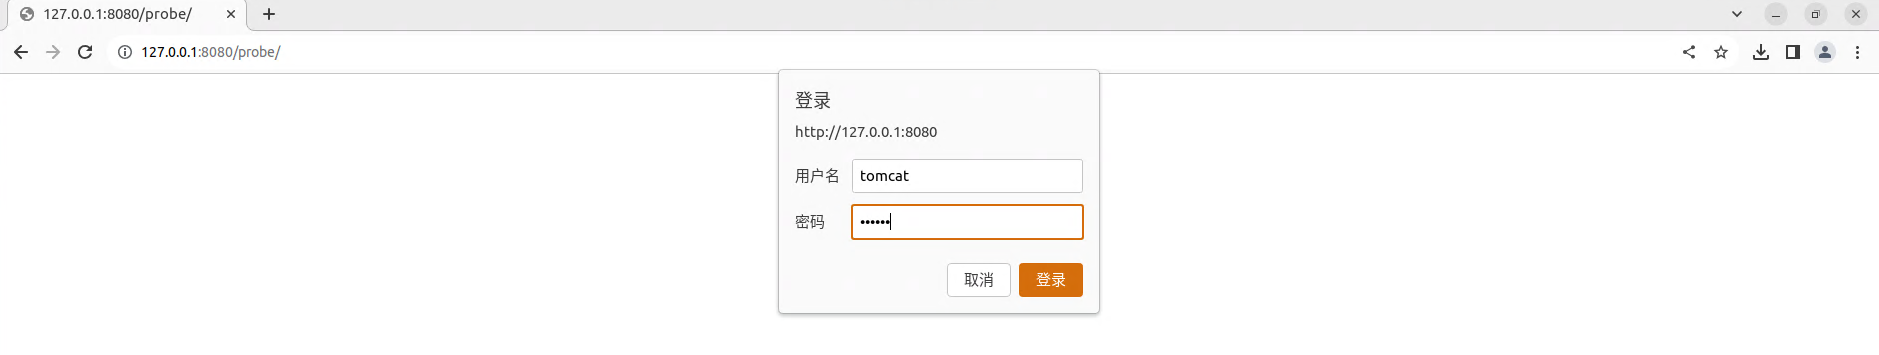
从releases页面下载对应的war文件,将其复制到Tomcat的webapps目录下即可,psi-probe使用的用户名密码和Tomcat-manager一致,需要提前配置。
Tomcat常用配置
| Attribute | Description | docs |
|---|---|---|
| maxConnections | 服务器同一时间接收和处理的最大连接数。 | docs/config/http.html |
| acceptCount | 当达到maxConnections时,系统为新请求提供的队列的最大长度。 | docs/config/http.html |
| maxThreads | Connector创建请求处理线程的最大数量,决定了可以处理的最大并发请求数量。 | docs/config/http.html |
| minSpareThreads | 始终保持运行的最小线程数,包括活动线程和空闲线程。 | docs/config/http.html |
| enableLookups | 设置true时调用request.getRemoteHost()会执行DNS查找,以返回客户端实际主机名。 | docs/config/http.html |
| autoDeploy | Tomcat是否在运行时定期检查新的或更新的web应用程序。 | docs/config/host.html |
| reloadable | 设置true时会监视WEB-INF/classes和WEB-INF/lib中的类更新,并自动重新加载Web应用程序。 | docs/config/context.html |
Nginx性能监控与调优
Nginx安装
Nginx文档:https://nginx.org/en/
可以选择下载二进制文件安装或者通过包管理器安装。
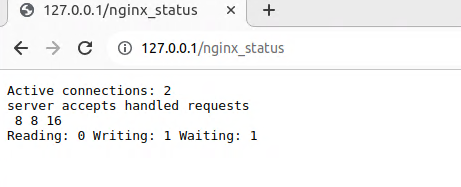
ngx_http_stub_status监控连接信息
文档地址:https://nginx.org/en/docs/http/ngx_http_stub_status_module.html
首先确认http_stub_status_module模块是否安装,使用nginx -V命令在输出的configure arguments中找到http_stub_status_module即表明模块已安装。
在/etc/nginx/conf.d/default.conf中配置如下信息:
location = /nginx_status {
    stub_status;
    access_log off;
    allow 127.0.0.1;
    deny all;
}
访问nginx_status即可展示连接信息
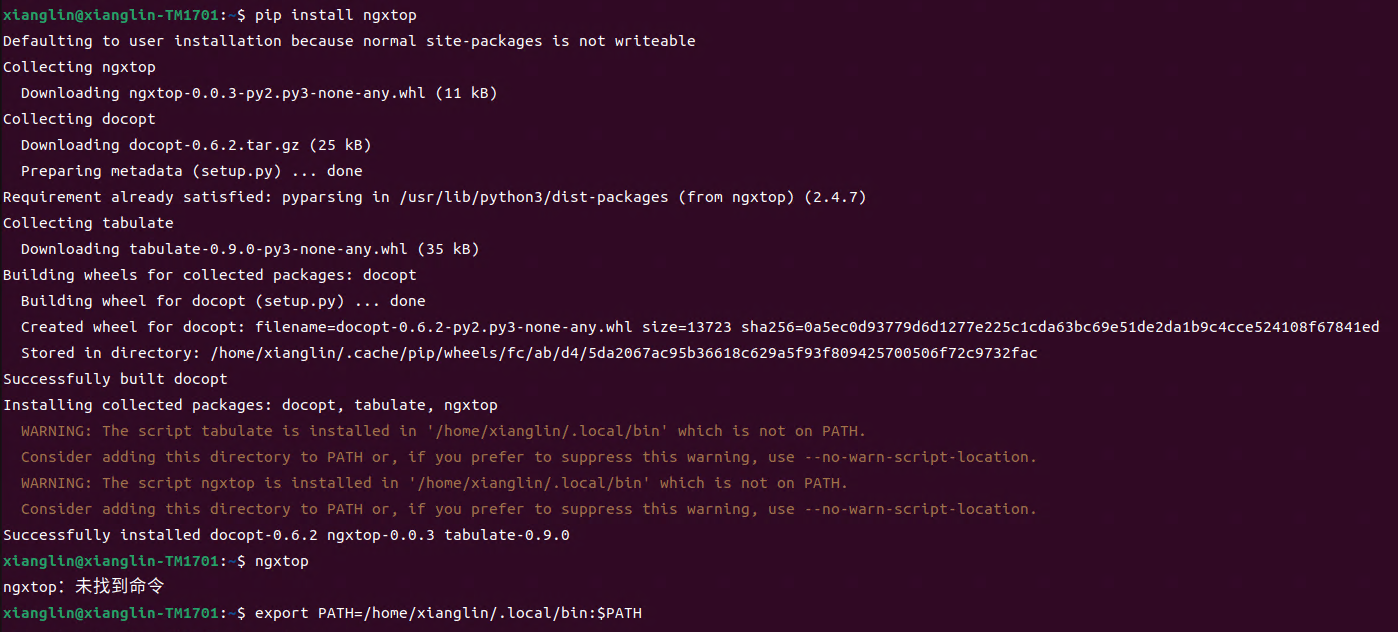
ngxtob监控请求信息
文档地址:https://github.com/lebinh/ngxtop
使用pip install ngxtop命令安装。
nginx-rrd图像化监控
文档地址:htts://www.nginx.com/resources/wiki/modules/rrd_graph/
nginx优化
配置线程数和并发数
# 工作进程
worker_processes  auto;
events {
    # 每个进程打开的最大连接数,包括nginx与客户端和nginx与upstream的连接
    worker_connections  1024;
    # 让nginx worker进程尽可能多地接受请求
    multi_accept on;

    use epoll;
}
配置与后端服务保持长连接,文档地址:http://nginx.org/en/docs/http/ngx_http_upstream_module.html#keepalive
upstream http_backend {
    server 127.0.0.1:8080;
    keepalive 16;
}

server {
    location /http/ {
        proxy_pass http://http_backend;
        proxy_http_version 1.1;
        proxy_set_header Connection "";
    }
}
配置压缩:http://nginx.org/en/docs/http/ngx_http_gzip_module.html
JVM层GC调优
垃圾收集器
GC调优指南:https://docs.oracle.com/javase/8/docs/technotes/guides/vm/gctuning/toc.html
如何选择垃圾收集器:https://docs.oracle.com/javase/8/docs/technotes/guides/vm/gctuning/collectors.html
G1最佳实践:https://docs.oracle.com/javase/8/docs/technotes/guides/vm/gctuning/g1_gc_tuning.html#recommendations
可视化GC日志分析工具
通用GC日志分析器:http://gceasy.io/
GCViewer:https://github.com/chewiebug/GCViewer